Performance Comparison of SentroPAT Compact with the SentroPAT FO system.
by Uwe Kirschner, Sentronic GmbHWe had the pleasure of hosting the Expo Feed Frame Simulator for about three months, from the PAT Meeting in December 2024 until the IFPAC Conference in March 2025. Shortly before returning it, we conducted a test series to compare the performance of the new SentroPAT Compact with the established SentroPAT FO system.
The results were later presented at IFPAC 2025.
Test Setup and Objective
Using the Expo Feed Frame Simulator, we tested a mixture of lactose, Avicel, and varying caffeine concentrations (0 to 5%) to evaluate how both systems perform under realistic process conditions.
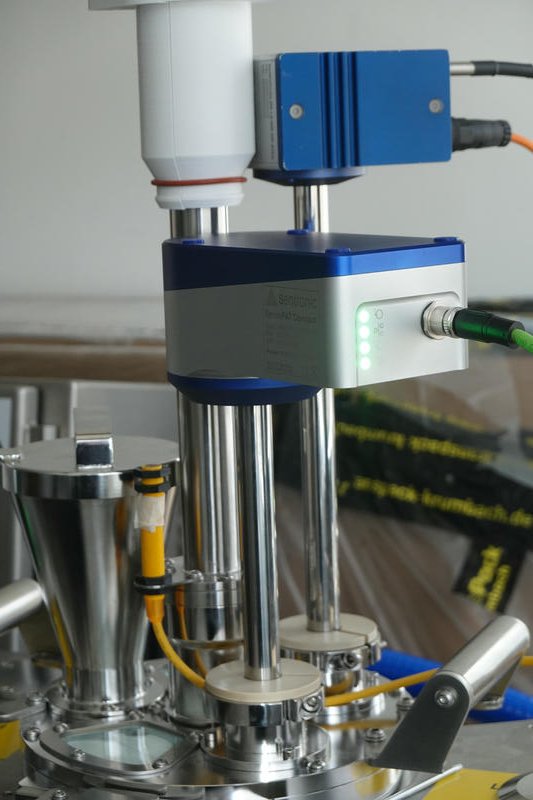
The photo shows the 300 mm version of the SentroProbe DR LS, connected via fiber optics and electronics to the SentroPAT FO system (not visible). In front of it, the SentroPAT Compact (200 mm version) is shown, requiring only a single Power-over-Ethernet (PoE) cable.
Instrument Baseline Noise
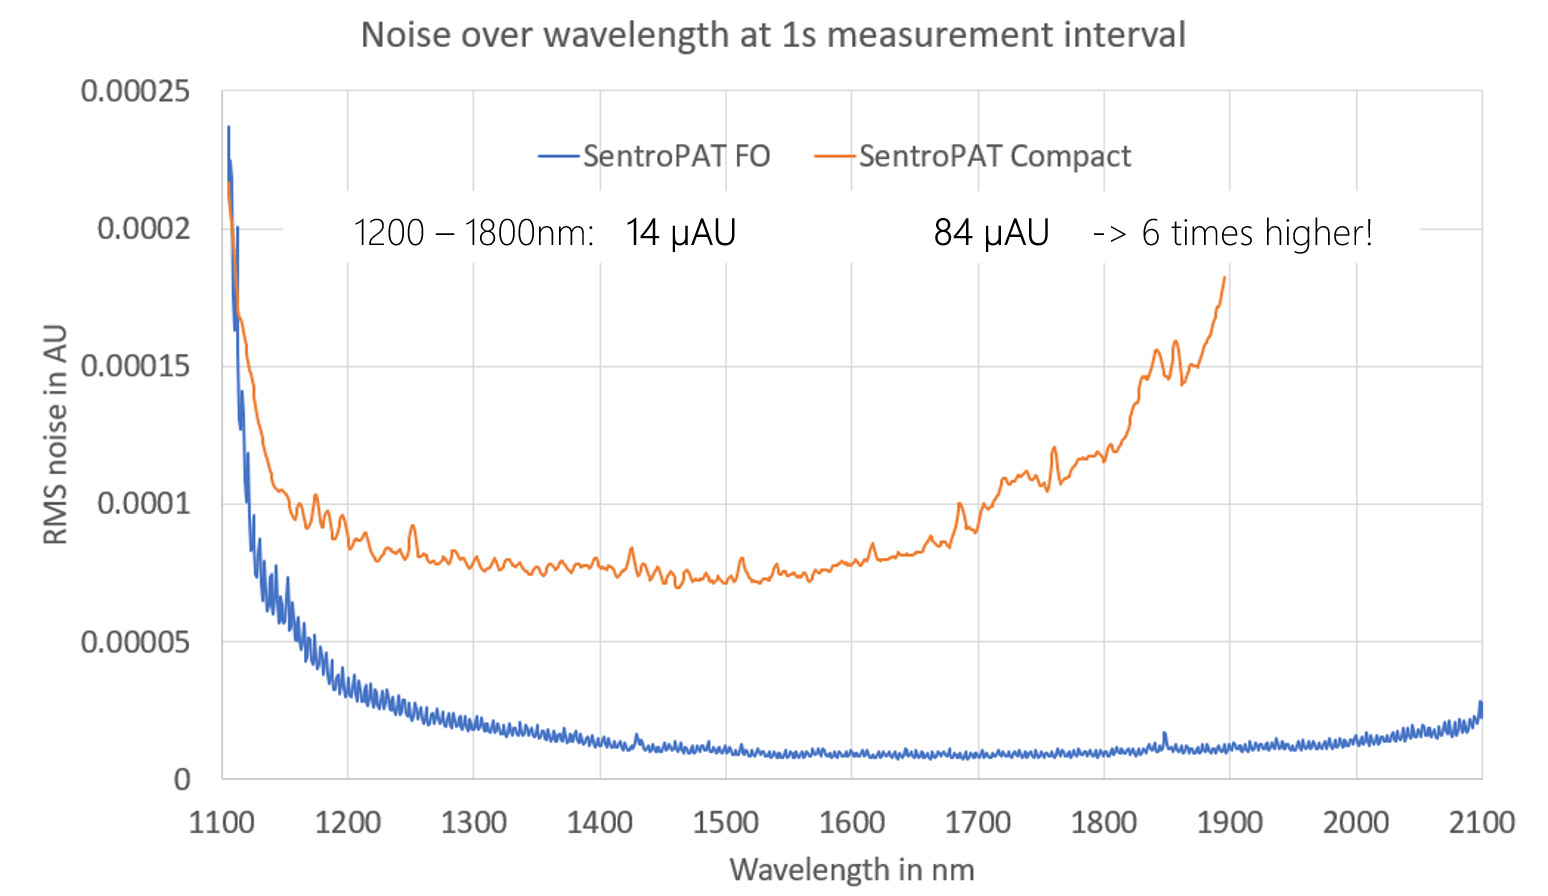
To assess the instruments' baseline noise, we configured a 1-second measurement frequency throughout the tests. Before starting the actual trials, we recorded a 15-minute static measurement using a white standard.
As expected, the larger SentroPAT FO—with its cooled detector—showed significantly lower noise levels (14 µAU) compared to the more compact SentroPAT Compact (84 µAU). But how does this affect performance in real-world measurements?
Operation of the Feed Frame Simulator
For each run, about 130–140 grams of material were used. Most tests were conducted at 50 RPM; the video was recorded at 10 RPM for better visualization. Material feed was not perfectly continuous—small gaps occurred, particularly behind the paddles. Both probes were inserted a few millimeters into the volume to ensure representative and stable measurements.
The Tests in a Nutshell
We designed the experiment as a stepwise blending process. Initially, 90 g of lactose and 40 g of Avicel were blended for a period of time. Then, caffeine was incrementally added in 1% steps. During the entire process, both instruments—as well as the Feed Frame Simulator—were running continuously.
This setup enabled us to perform the experiments efficiently, collecting synchronized data from both systems for a direct, head-to-head comparison.
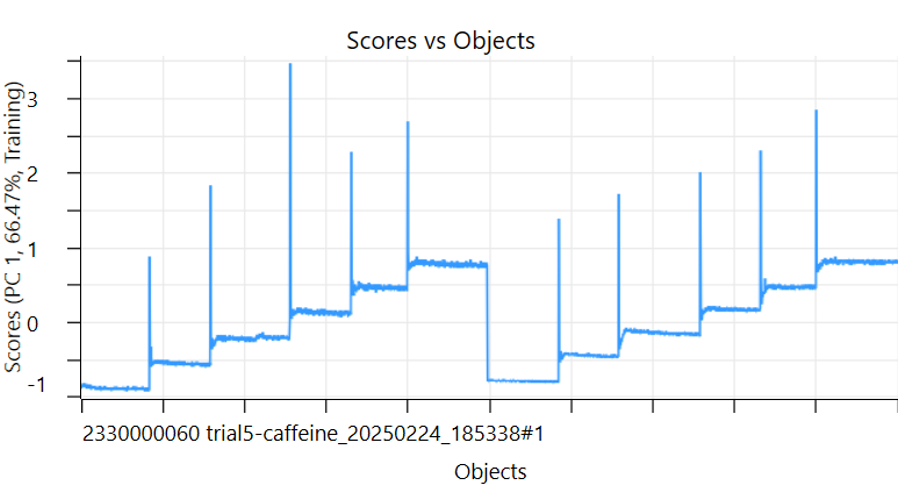
In the graph, you can see PCA Factor 1 from a common PCA model that includes data from both instruments during a full experiment. The left portion of the graph represents the SentroPAT Compact; the right portion shows data from the SentroPAT FO. PCA Factor 2 (not shown here) captures spectral differences attributed to the instrument types themselves.
PLS Method Development for Quantitative Comparison
As a next step, quantitative models using PLS (Partial Least Squares) were developed. For this, data from experiment 5 out of the 6 runs was used for model building. The resulting one-factor model was then used to predict the data from all six runs. Separate models were built for each instrument.
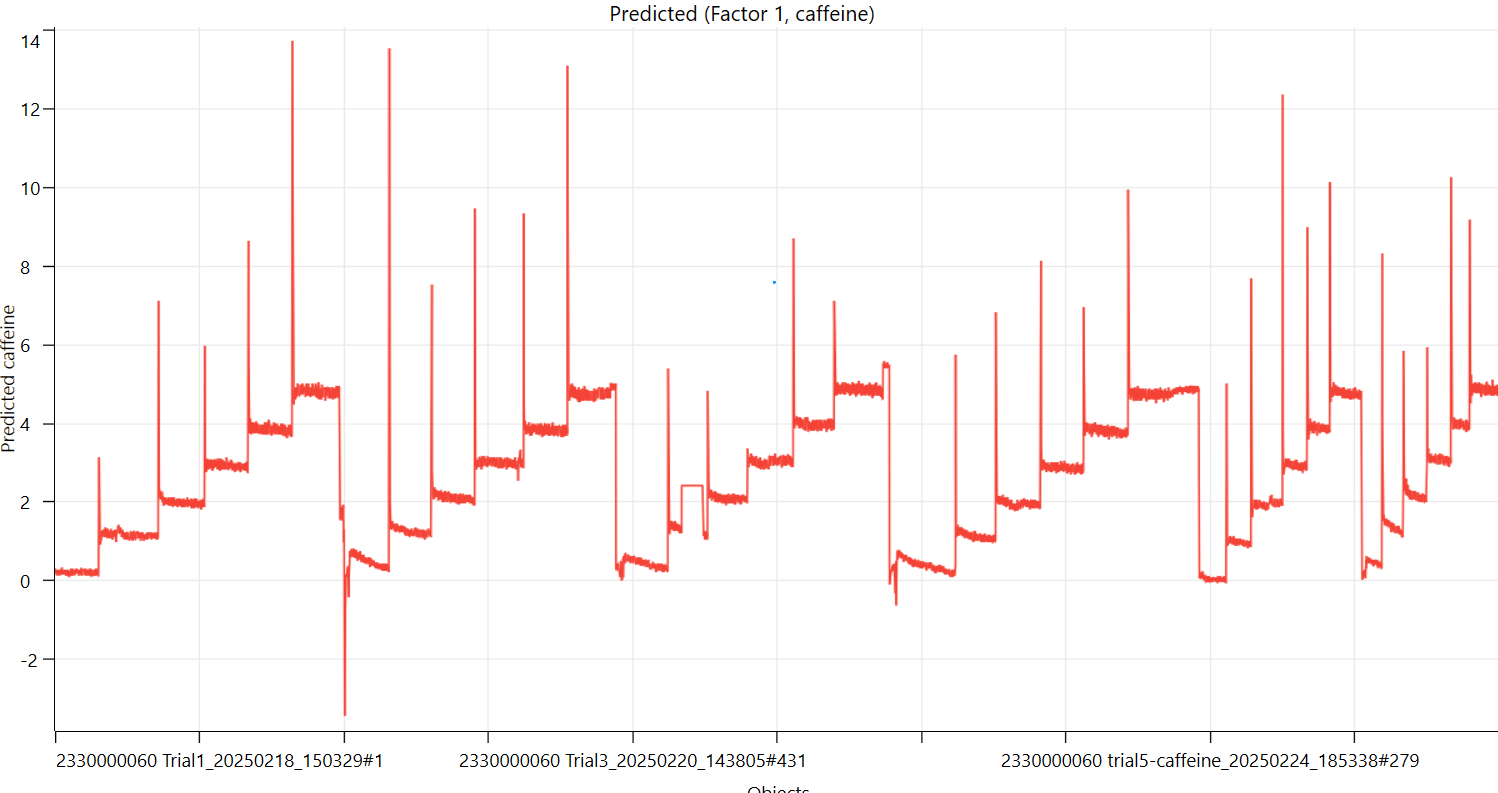
In the graph, you can see the prediction results across all six experiments for the SentroPAT Compact. The experiments were mostly repeat trials conducted within the span of one week. Various adjustments and optimizations were applied, primarily to the SentroPAT Compact, since software development for this instrument was still ongoing during testing.
Results and Conclusions
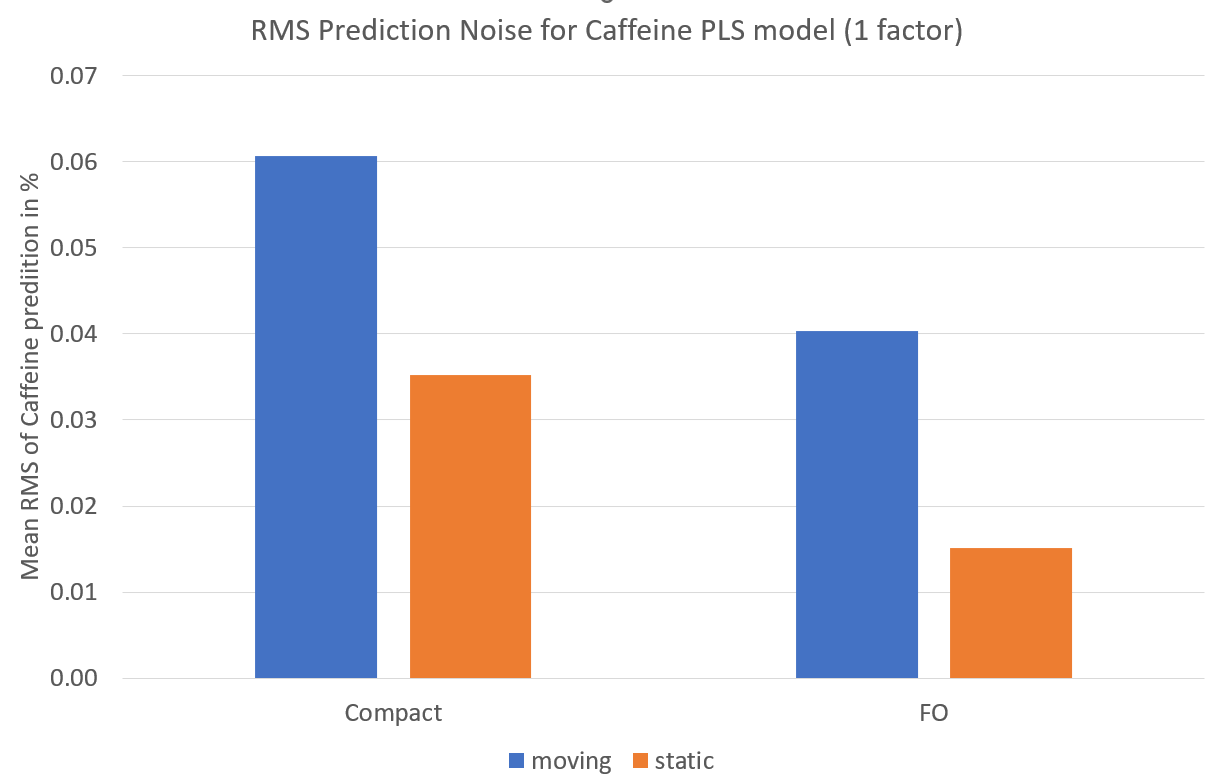
Using the concentration plateaus after each mixing phase, we investigated the standard deviation of the predictions for both instrument types. The SentroPAT Compact showed values of approximately 0.06% caffeine, while the SentroPAT FO achieved 0.04%. This difference can largely be attributed to the higher instrument noise of the Compact, as discussed earlier.
As part of the experiment, we also stopped the Feed Frame Simulator at the end of each run to obtain data under static conditions. While the absolute values may differ in this case, the results are no longer influenced by inhomogeneities in sample concentration or other physical effects. Under these conditions, the prediction noise of the SentroPAT Compact dropped to 0.035%, compared to 0.015% for the SentroPAT FO.
Conclusion:
The SentroPAT Compact delivers strong performance but does not fully match the precision of the SentroPAT FO. However, the key advantage of the SentroPAT Compact lies in its simplicity: it requires only a single Power-over-Ethernet cable, eliminating the need for fiber optics and making installation significantly easier.
If you're interested in reading the full PDF of the presentation, you can download it here.