We often highlight that rejecting outlier spectra is a key feature of our diode-array-based NIR systems. And just as often, we're asked what that actually means. In short, it’s the ability of our systems to instantly discard spectra deemed ‘outlier’—on a millisecond scale—right after measurement.
Is this important? We believe so. Is it new? Not at all. Long time ago, when we were still working more in Polymer Industry, we published an article “Please Don’t Disturb”, describing transmission measurements in resins, where air bubbles distorted spectra—a perfect example of early outlier rejection.
Since then, this capability has been used in many applications. It’s a powerful way to improve data quality with diode-array spectrometers, and it's continually evolving. Even today, the simplest method is to monitor intensity at a specific wavelength.
How does it work?
Before any spectrum is processed, the intensity at a set wavelength is checked. It’s well known—and expected—that this can suddenly spike. In the old article from 2002, such jumps were caused by air bubbles in resin. Today, in diffuse reflectance applications, disturbances in sample presentation (e.g., height or volume) or signals from the equipment itself (like blades in a tablet press – see the video in this post) can impact spectra. By removing these ‘wrong’ spectra with bad sample presentation, the averaged result is much more representative of the actual material.
A common counterpoint is that chemometric models already detect poor-quality predictions using tools like Hotelling T², DmodX, or Mahalanobis distance. And that’s true—they work well. But these rely on the average of many spectra, so bad data can lead to more data loss and a greater loss of process insight. Ensuring only valid spectra are averaged minimizes this risk right from the start.
Is it difficult to configure?
Yes and no. Predefining values isn’t feasible, and auto-configuration isn’t available. Settings depend on the process, equipment, and sometimes even the product—so configuration becomes part of method and model development. But once understood, only a few parameters need to be set:
- Wavelength to monitor
- Upper and lower threshold
- Dynamic absorbance band
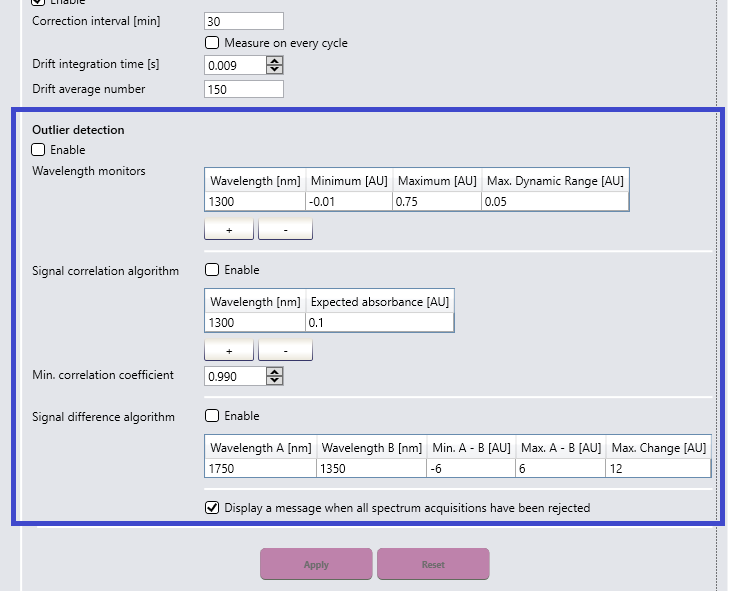
Configuration as shown availabe in SentroSuite version 3.5.0.0 and higher
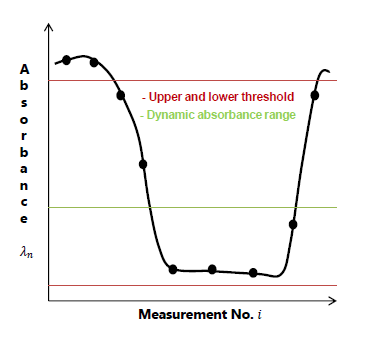
As a result, only spectra falling within the defined valid range will be accepted and used for further processing.
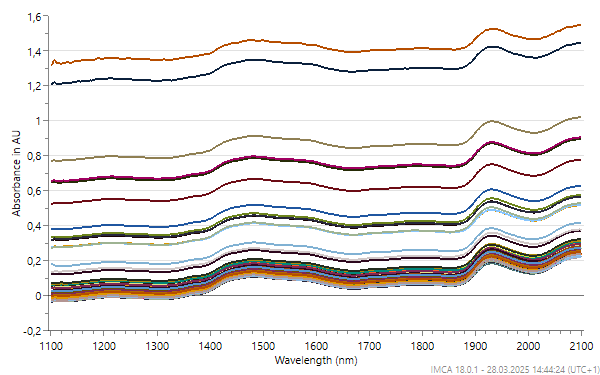
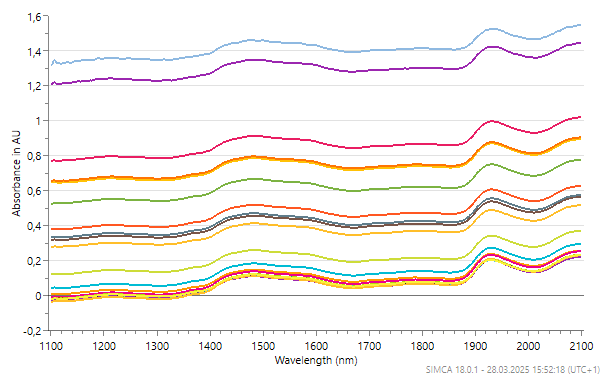
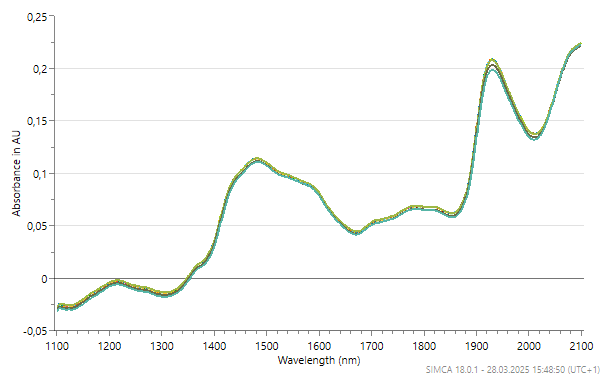
The following section shows the effect of this filtering on the resulting averaged spectra at a total measurement time of 0.5sec (60 averages at an integration time of 8 msec).
Is this all?
Not at all. More advanced filtering options exist—such as checking correlations between multiple wavelengths. But the foundational method, developed 20 years ago remains, valid and widely used. Additional, more powerful approaches will be covered in future blog posts.
One of those will also explore how filtering statistics can help detect sample interface fouling. While the goal is always to avoid fouling, we all know it can’t always be prevented.