Introduction
Bin blending is a popular choice for on-line PAT applications of NIR spectroscopy, dating all the way back to the initial investigations of PAT in the pharmaceutical industry. NIR spectroscopy provides an effective method to monitor the blend uniformity and determine process endpoint for bin blending, without having the negative side effects of thief sampling. Lean chemometrics has also played a part in the success of NIR PAT with bin blending, with the challenge of calibration burden in these applications motivating the creation of chemometric techniques such as conformity index.
Lean chemometric techniques remain viable as MVDA methods analysis of NIR PAT spectra in bin blending applications. For example, moving block standard deviation (MBSD) is explicitly referenced as an appropriate technique for qualitative assessment of blending endpoint detection by the EMEA guidance on NIR spectroscopy. Given recent interest in lean chemometric methods, we evaluated the feasibility of a pure component method (specifically iterative optimization technology (IOT) algorithms) for qualitative monitoring of bin blending using NIR PAT. Pure components methods use only the pure component spectra of each chemical constituent to estimate concentrations from the mixture spectrum. However, these techniques have not been widely evaluated for qualitative monitoring in bin blending, although quantitative applications have been published.

The NIR spectra (captured by a SentroPAT BU II) analyzed were captured from a blending process of a pharmaceutical powder mixture consisting of three stages (see the above figure). Between the pre-blending and main blending stages, a screening step was implemented to break up agglomerations in the powder mixture. The pharmaceutical powder was composed of an active pharmaceutical ingredient (API) at a target concentration of 10 %w.w and five excipients (A–E). Thank you to Phil Doherty for providing the data utilized in this blog post!
The IOT algorithm was preferred as the pure component method for qualitative bin blend monitoring due to the enhanced interpretability it offers over other pure component methods such as classical least squares (CLS) regression. The individual trends for the chemical constituents at each blending stage (separate by the black dashed lines) are shown in the plot below, with Excipient E not included due to not having an available pure component spectrum. The lack of Excipient E was accounted for by modifying the summation (closure) constraint of IOT to ∑r ≤ 100%.
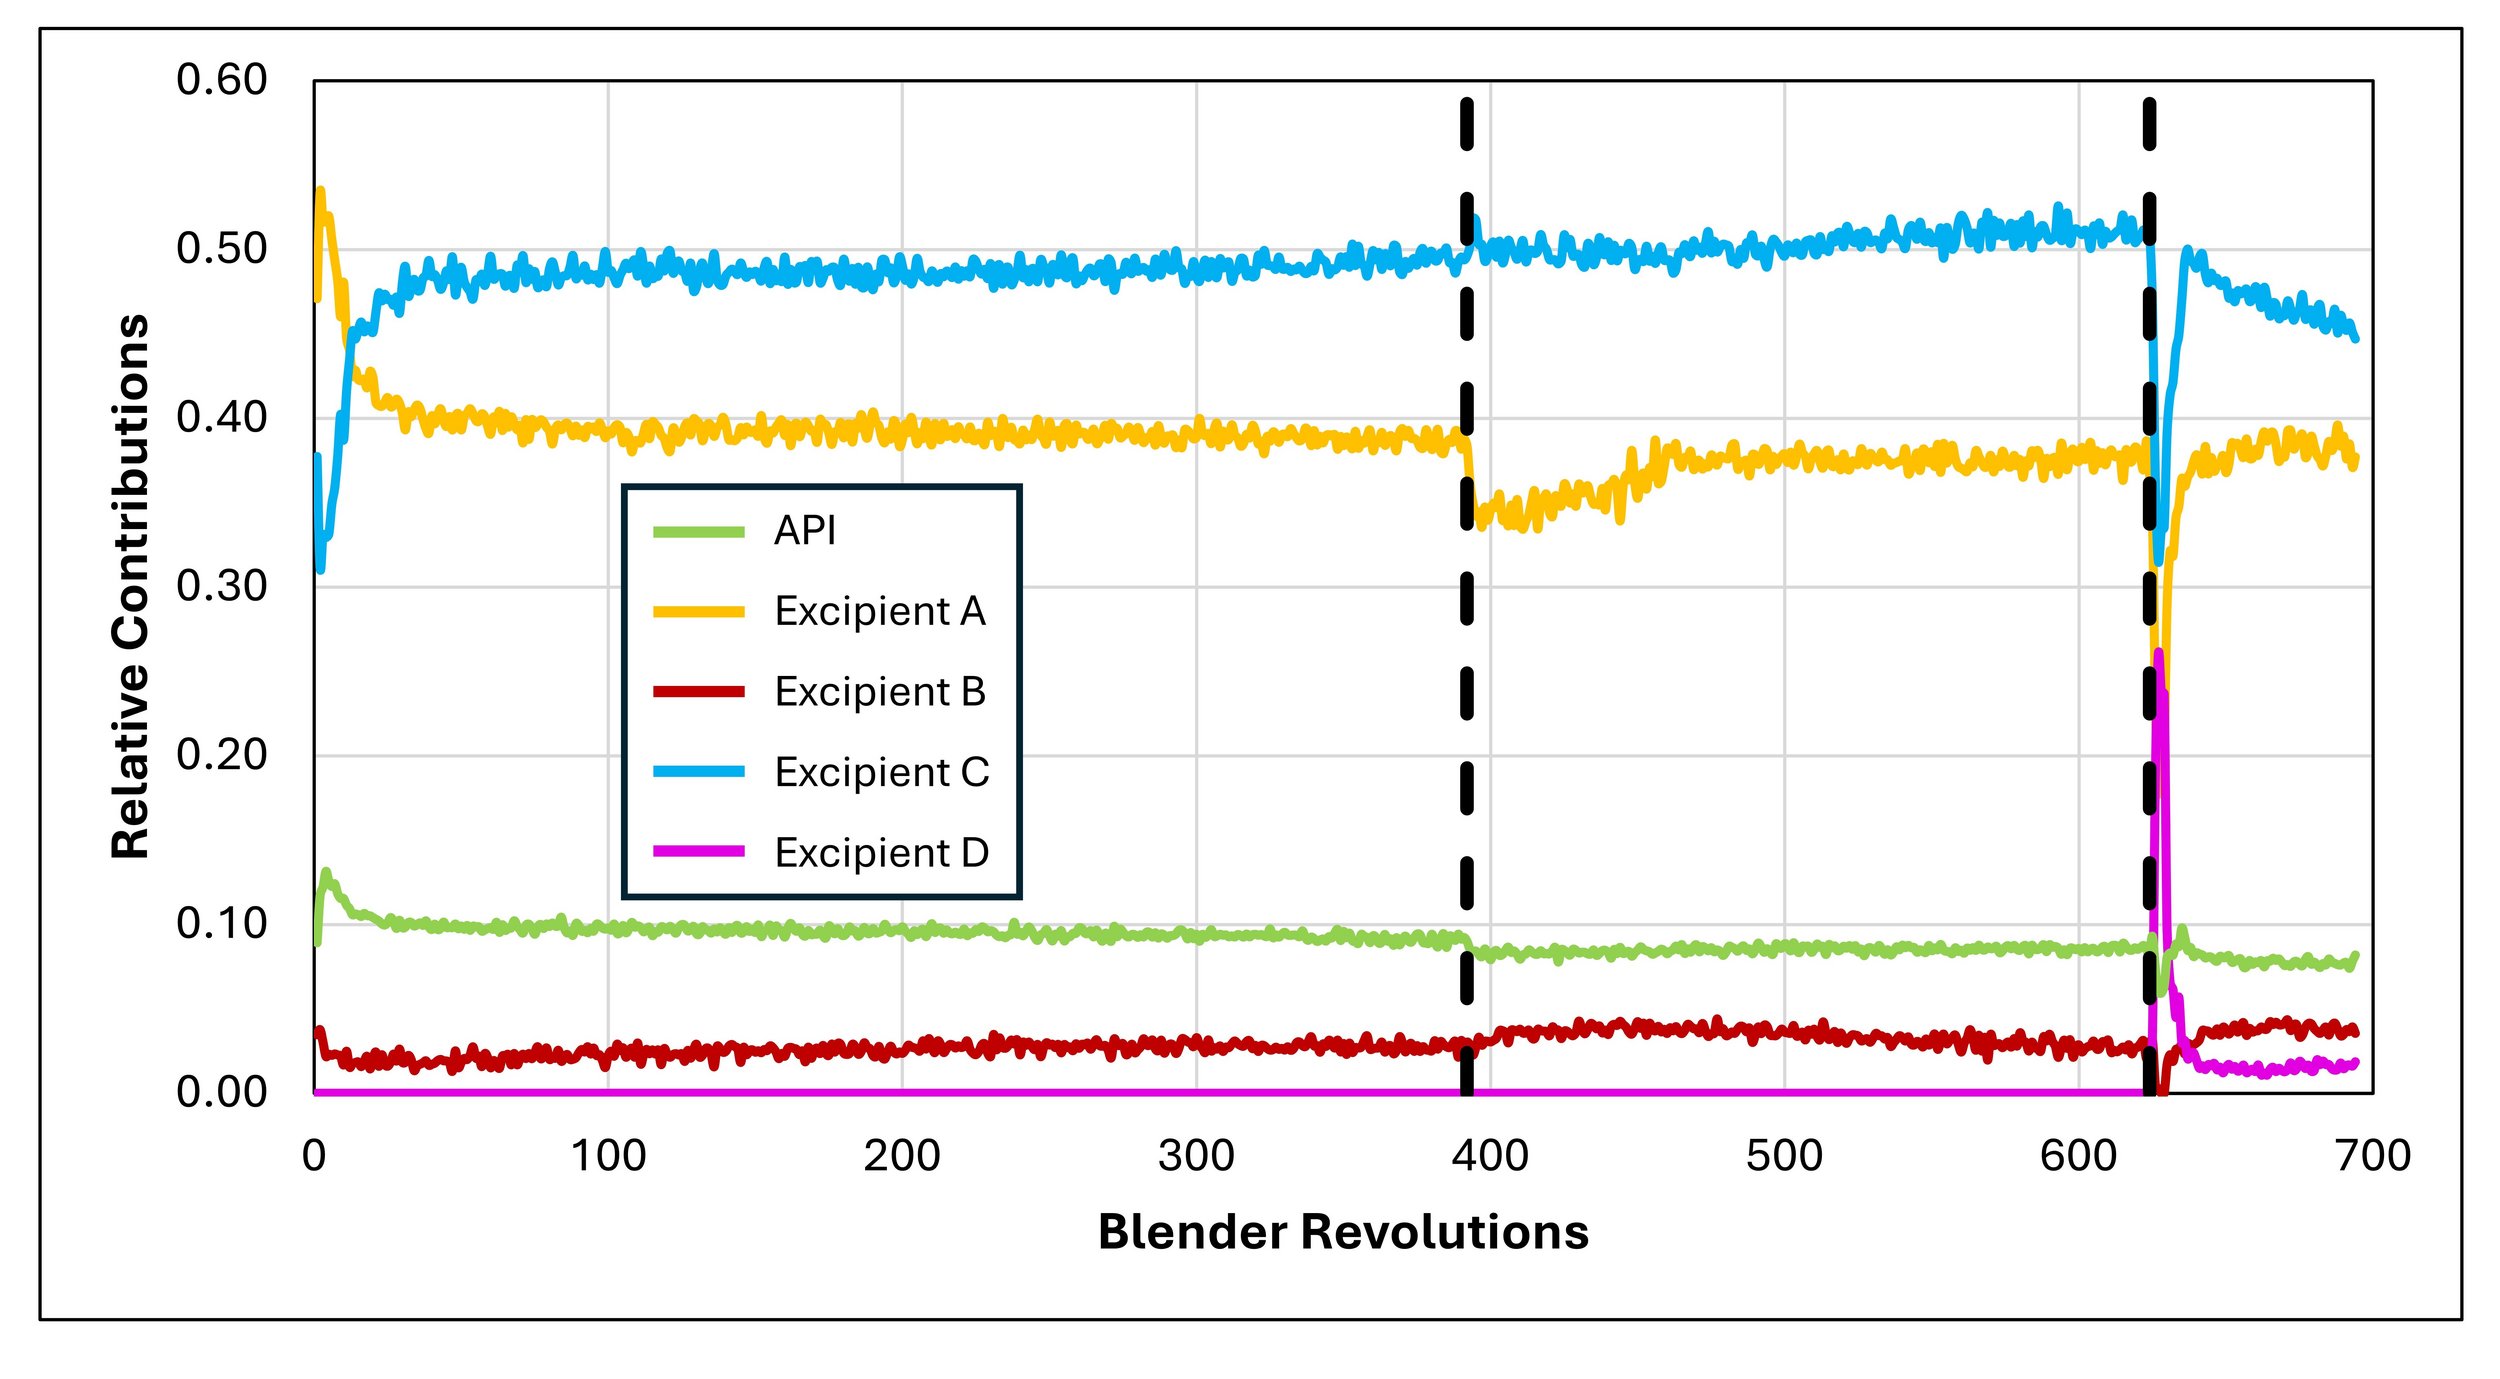
The individual relative contribution trends of the chemical constituents that are outputs from the IOT analysis of the NIR spectra reveal process insights about the bin blending unit operation for this pharmaceutical powder mixture:
- Initial fill order from relative contributions in the beginning of the pre-blend stage
- Excipient A and B blending in the main blend stage imply the agglomerations broken up by screening were composed of these excipients
- The addition of Excipient D to the pharmaceutical powder mixture is shown by its spike in relative contribution during the lubrication stage
- The rank ordering of the relative contributions for each chemical constituent matches the rank ordering of concentration in the target formulation
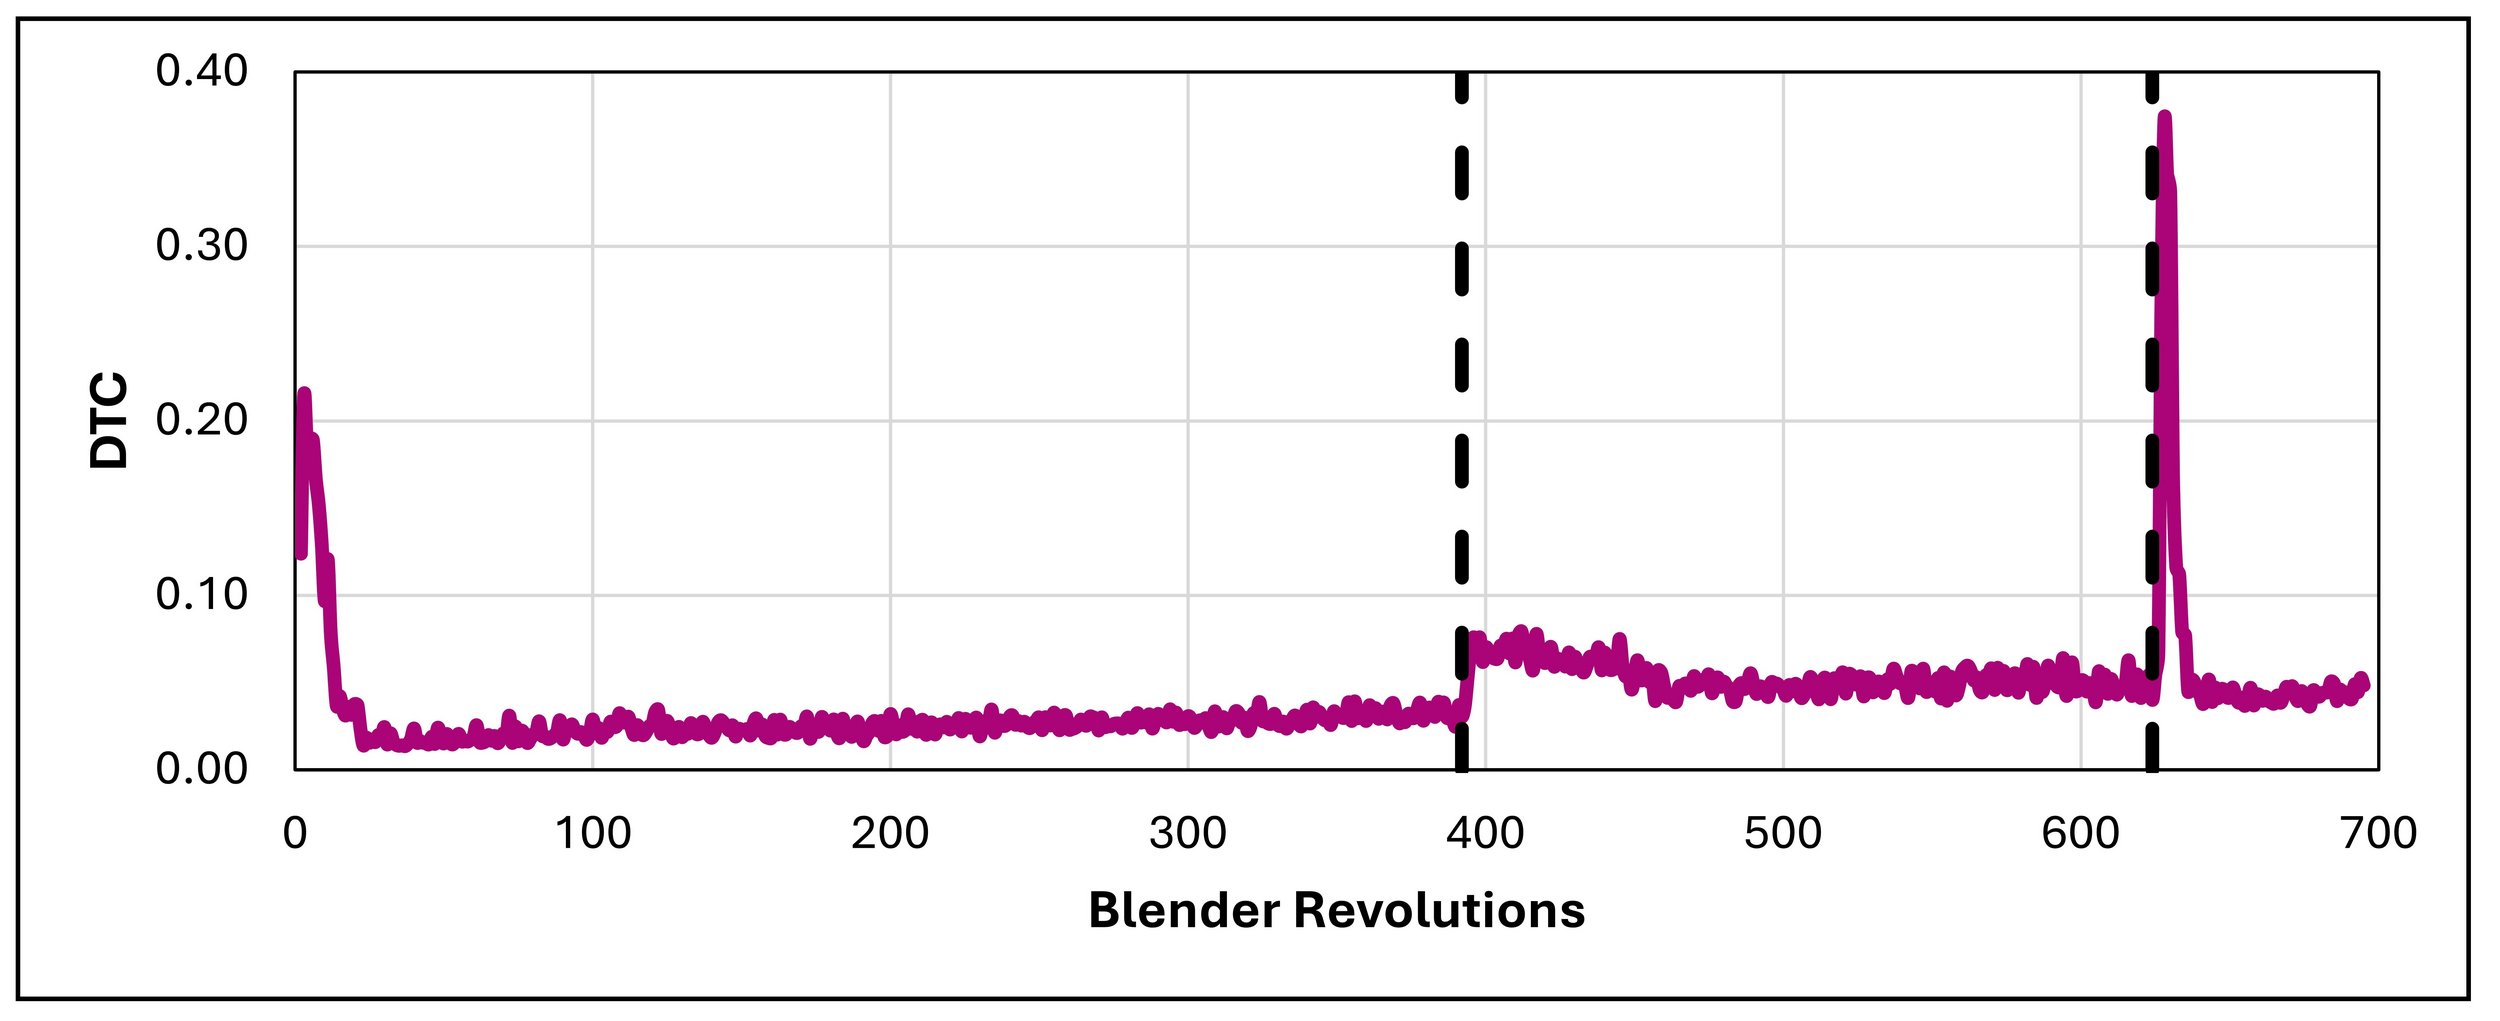
While reviewing the individual qualitative trends of chemical constituents is useful for developing process knowledge, it is often desirable to summarize the blending process as a singular trend. To facilitate this, the concept of distance to target concentration (DTC) was introduced for qualitative assessment of bin blending. The DTC calculates the Euclidean (L2) distance between the relative contributions of the chemical constituents to the nominal target concentration of the target blend. As DTC is intended for qualitative assessment, blend uniformity is considered achieved when the DTC trend stabilizes for a specific number of blender revolutions and not necessarily when DTC hits zero. This is reflected in the DTC trend (figure below) stabilization at the end of each stage observed for this blending process, implying blend uniformity was achieved.
Pure component methods appear viable as chemometric techniques to enable qualitative blend uniformity assessment using NIR spectroscopic PAT. The individual trends of chemical constituents can provide process insights and DTC allows for evaluating the blending process as a single trend. Optimization of the preprocessing treatments alongside some appropriate training data would enable the IOT algorithm to be deployed as a quantitative method instead of the qualitative method demonstrated here. The IOT algorithm is coming soon to SentroSuite to supplement the pre-existing lean chemometrics offerings (MBSD, moving block F-test) from Sentronic and further support your NIR PAT needs!